Autodesk Moldflow injection molding simulation software has a simulation tool that can help you validate and optimize plastic parts, injection molds and injection molding processes. The software provides designers, mold production staff, engineers guide, to show the wall thickness, gate location, material simulation settings and results illustrate geometric shape changes affect how manufacturability. From the thin-walled parts to thick-walled, robust parts, Autodesk Moldflow geometry support can help users to test before the final design decisions assumed scheme.
Advantage of Moldflow Analysis:
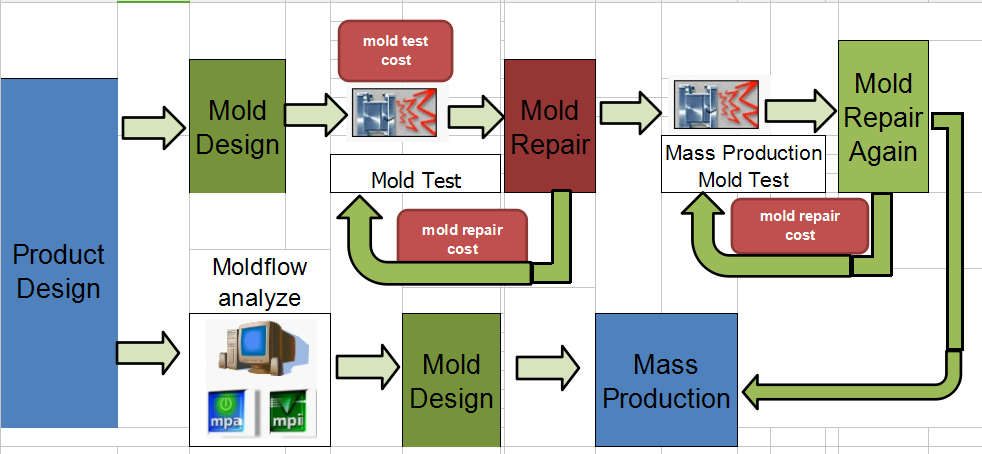
1、Shorten the development lead time
2、Reduce the mold test cost and mold repair cost.
3、In advance to solve possible problems during mass production.
4、Reduce the total cost
| Item | Name | Description |
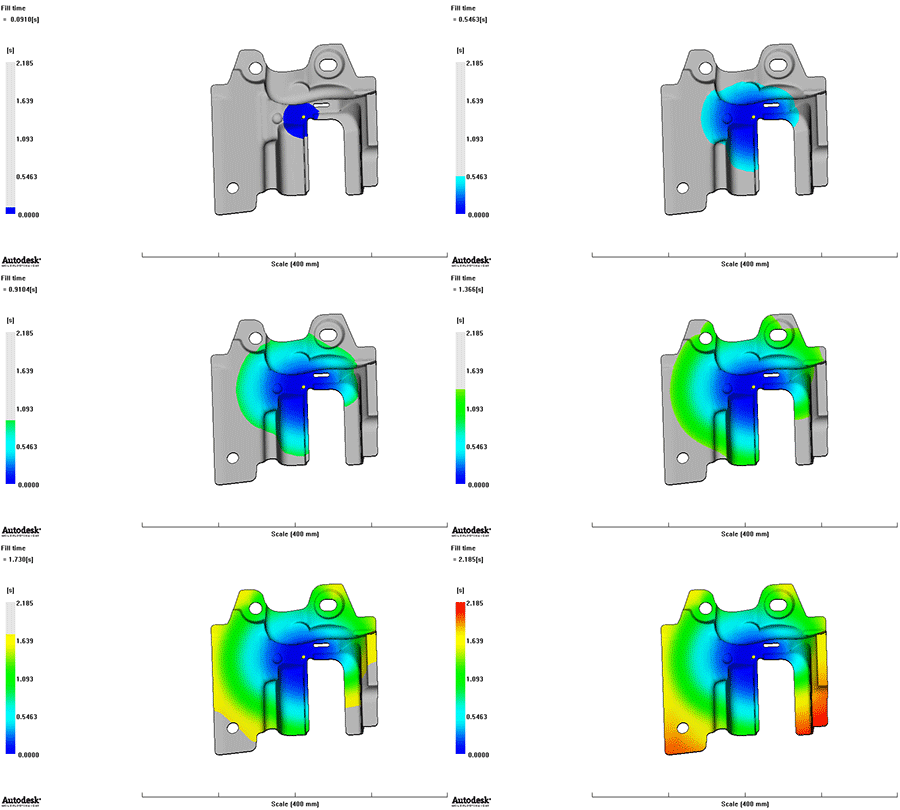
| 1 | Fill time | The Fill time shows the stream forward position at regular intervals of the cavity filling. Each contour filling each section model depicts the same time. When filling start, shown in dark blue, the last place filled red. If the product short shot, unfilled portions without color. |
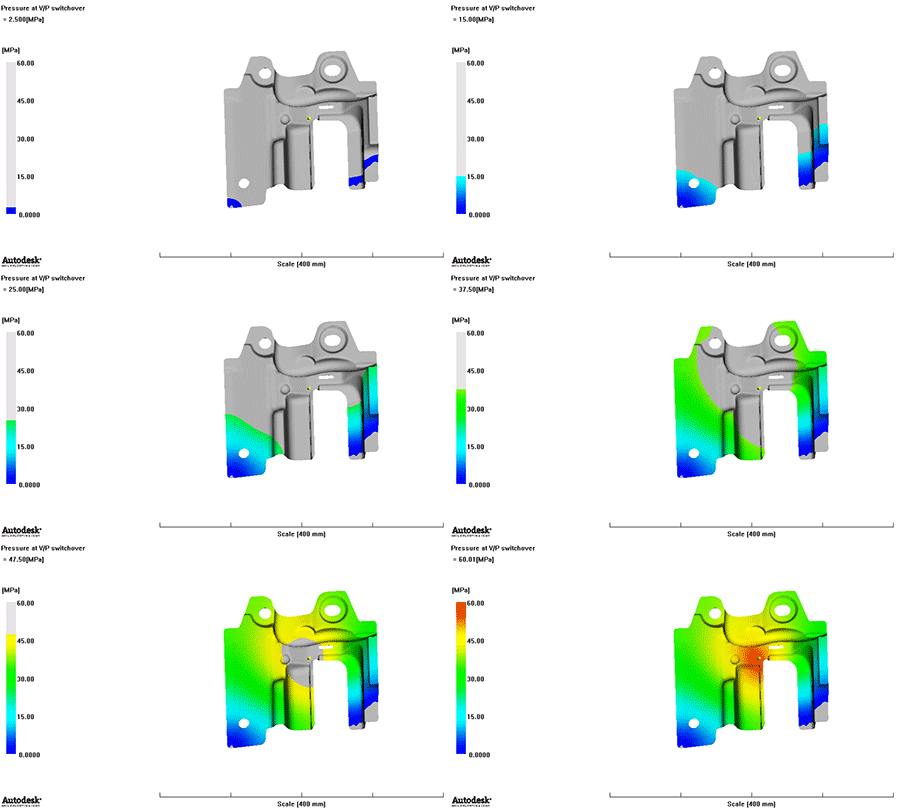
| 2 | Pressure at velocity/pressure switchover | The Pressure at velocity/pressure switch-over result shows the pressure distribution through the flow path inside the mold at the switchover point from velocity to pressure control. |
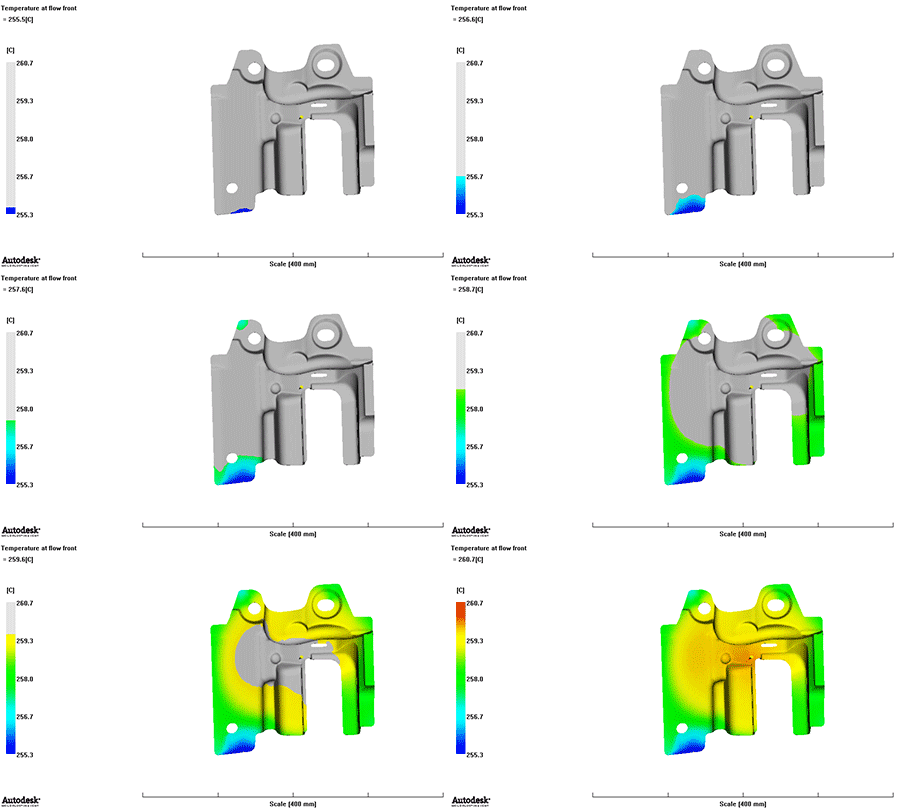
| 3 | Temperature at flow front | The Temperature at flow front result shows the temperature of the polymer when the flow front reached a specified node. This can be at the end of the analysis, or at specified times during the analysis. |
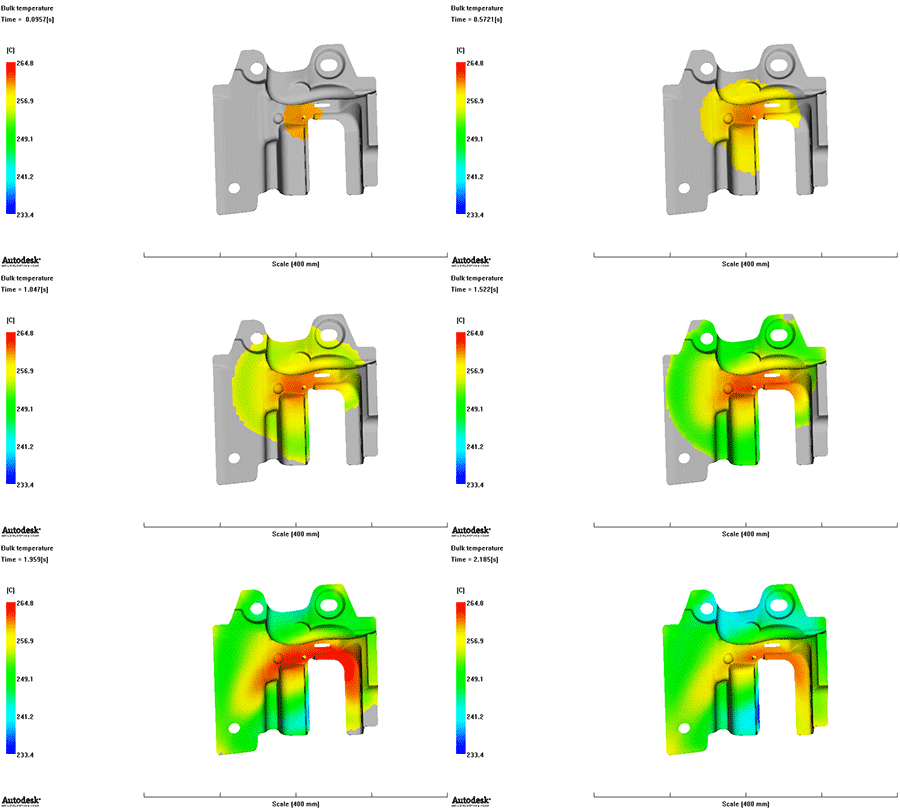
| 4 | Bulk temperature | The temperature of polymer melt changes not only with time and location, but also with thickness during the entire injection molding cycle. It is difficult to illustrate all these changes in a single display. Instead, bulk temperature is used to indicate the weighted average temperature across the thickness. Bulk temperature has more physical significance than a simple average temperature as the polymer melt flows. Bulk temperature represents the energy that is transported through a particular location. |
| Item | Name | Description |
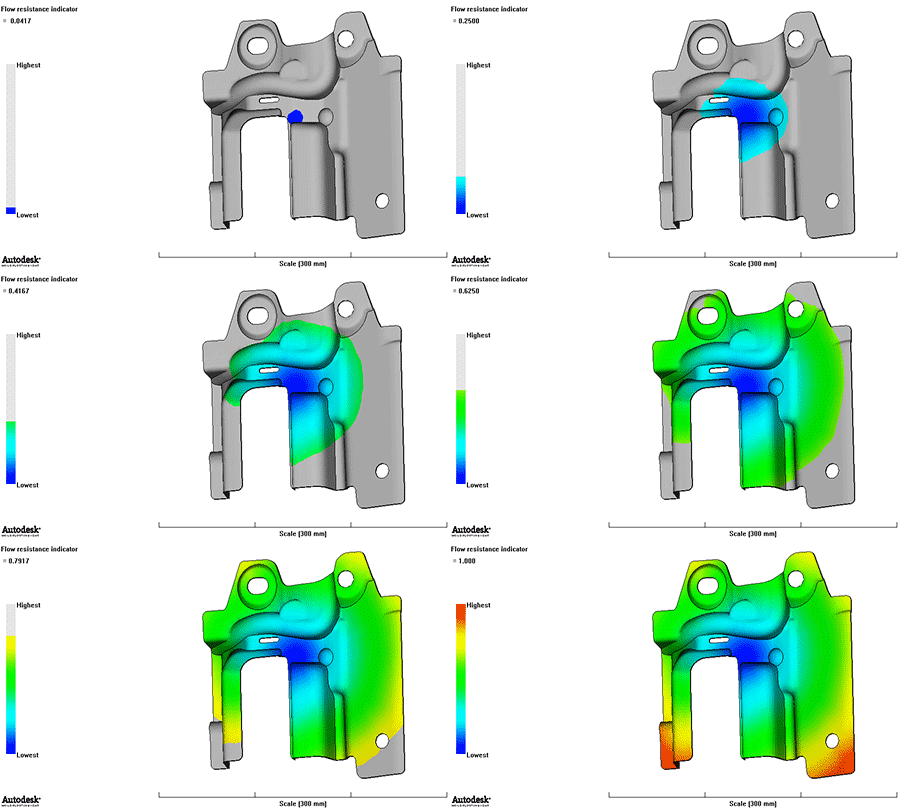
| 5 | Flow resistance indicator | Flow resistance indicator shows the flow resistance from different melt flow front gate location. The value of the flow resistance is from 0 to 1. The value of the flow resistance more higher, the melt flow more difficult. |
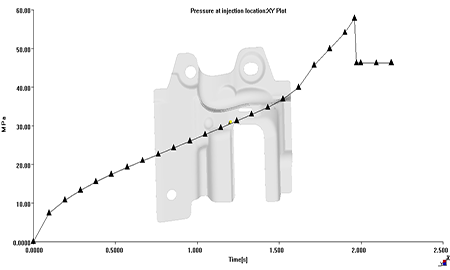
| 6 | Pressure at injection location:XY plot | The Pressure at injection location result is an XY plot, and shows the pressure at various times during the filling and packing phases of the analysis. |
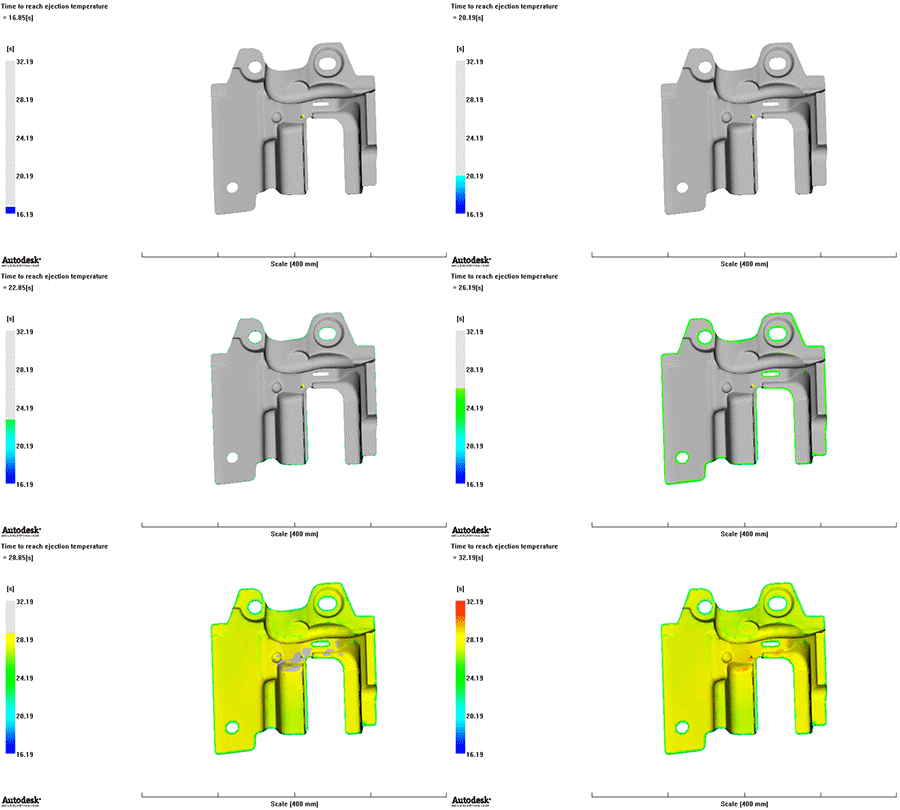
| 7 | Time to reach ejection temperature | Time to reach ejection temperature result is the temperature of the display parts from cooling temperature to reach the ejection of the time required |
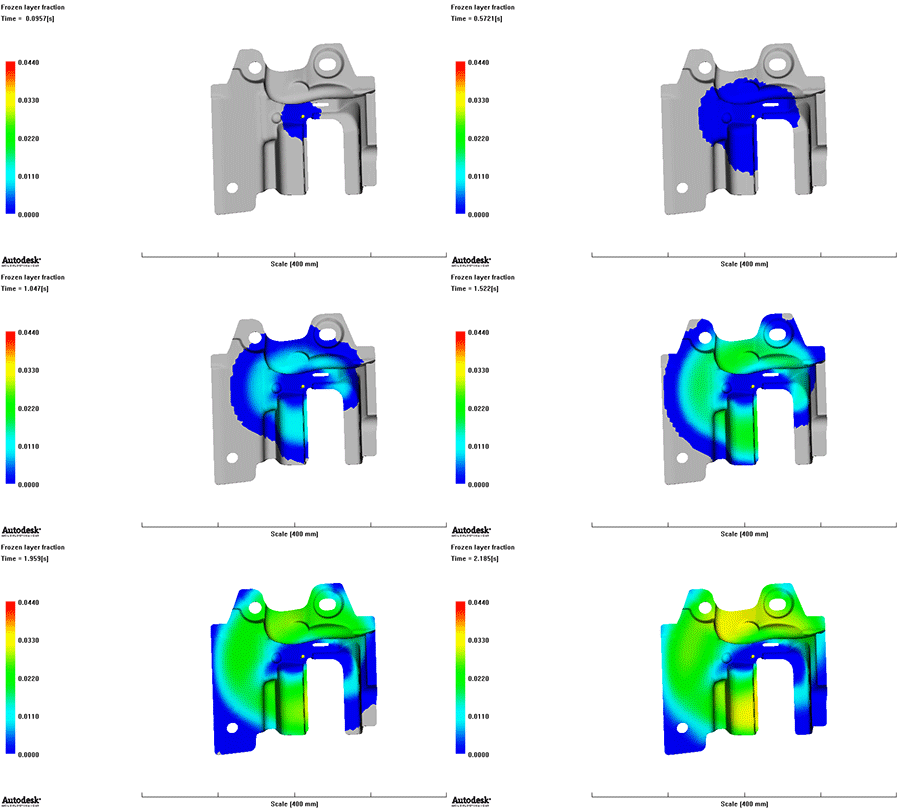
| 8 | Frozen layer fraction | The Frozen layer fraction result shows the thickness of the frozen layer as a fraction. A higher value represents a thicker frozen layer, and therefore, a thinner polymer melt (flow) layer. |

| Item | Name | Description |
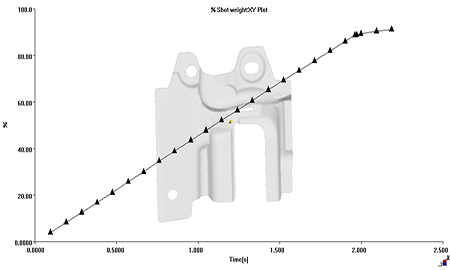
| 9 | %Shot weight:XY plot | The % Shot weight result is an XY plot, and shows the total shot weight, as a percentage of the total part weight, at various time steps during the filling analysis. |
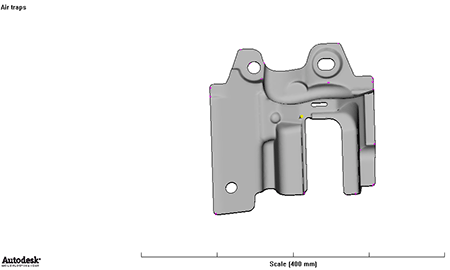
| 10 | Air traps | The Air traps result shows a red line wherever an air trap is likely to occur. This may be where the melt stops at a convergence of at least 2 flow fronts, or at the ends of flow paths. |
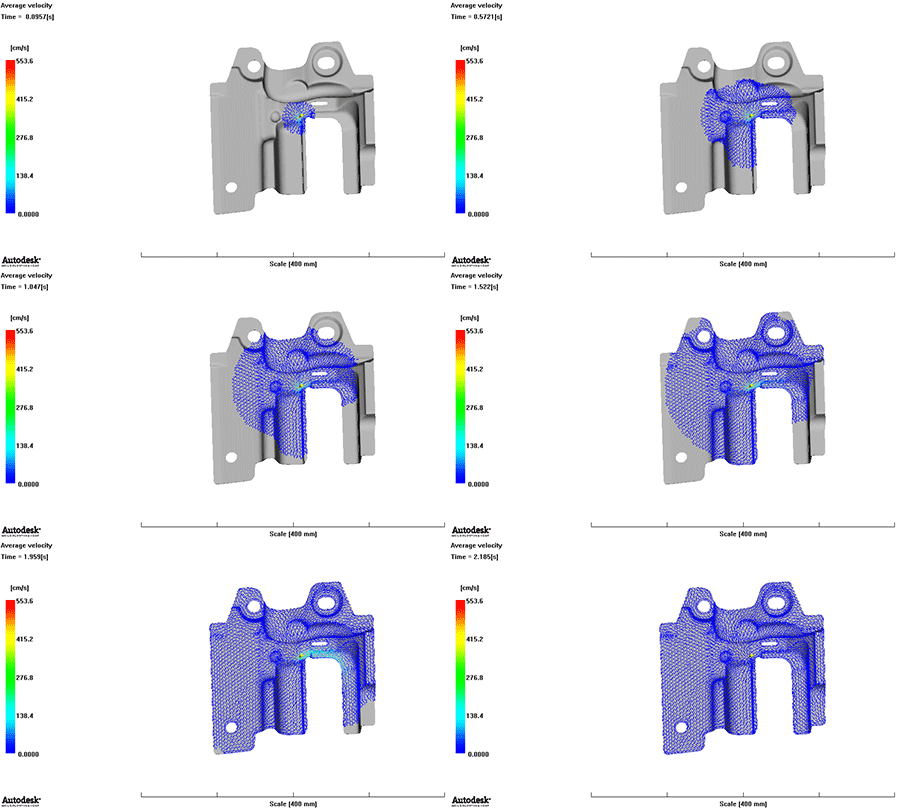
| 11 | Average velocity | The Average Velocity result shows the average magnitude of velocity of the polymer inside the mold cavity over time. |
| 12 | Clamp force:XY plot | The Clamp force result is a time series result, and shows the force of the mold-clamp over time. The clamp force is the resultant value of the pressure distribution over the entire part. It is a history of the force resultant from filling and packing pressure that acts to open the mold. |
| Item | Name | Description |
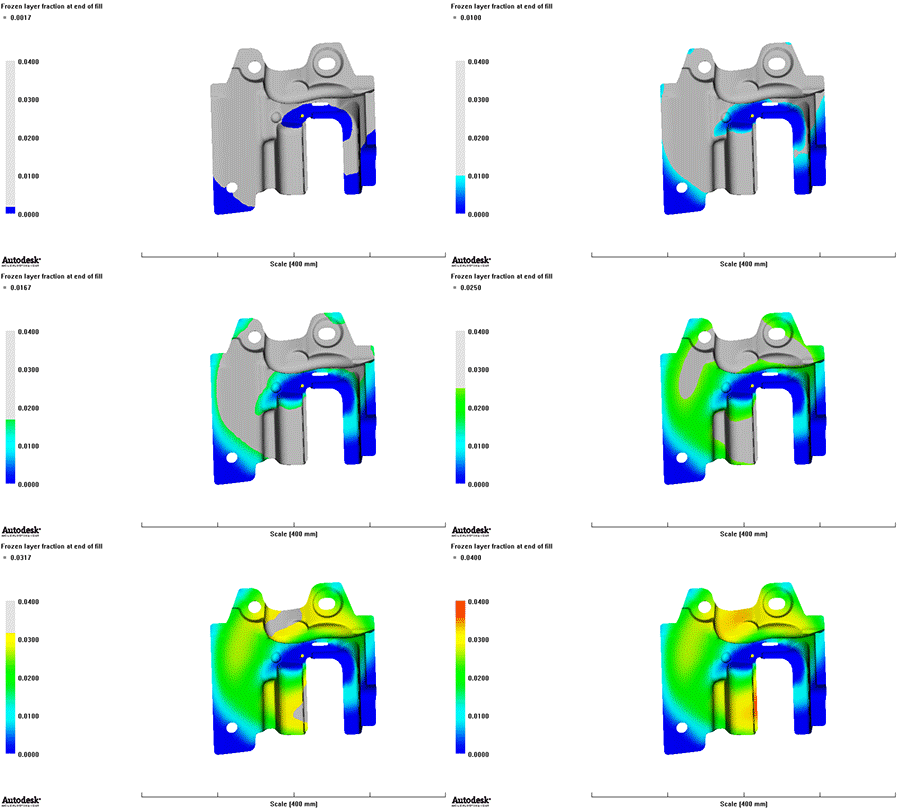
| 13 | Frozen layer fraction at end of fill | The Frozen layer fraction (end of filling) result plot shows the thickness of the frozen layer as a fraction, at the end of the filling phase. A higher value represents a thicker frozen layer, and therefore, a thinner polymer melt (flow) layer. |
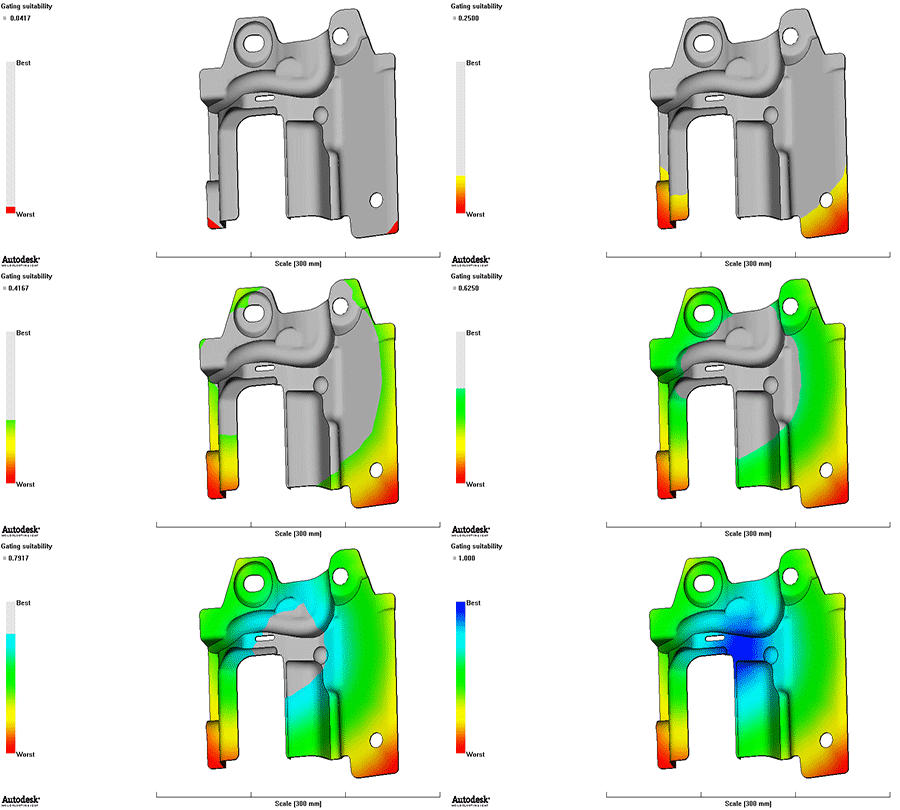
| 14 | Gating suitability | Gating suitability shows reasonableness factor profile of the gate locations. The factor value more smaller, the reasonableness of the molding gate locations more smaller. |
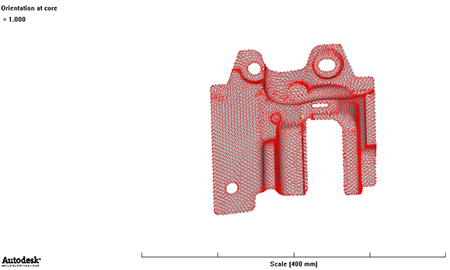
| 15 | Orientation at core | The result shows the orientation at core of the products. At the same time, it shows all the average alignment direction. |
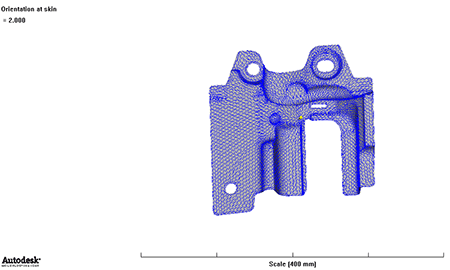
| 16 | Orientation at skin | The result shows the Orientation at skin of the products. At the same time, it shows all the average alignment direction. |
| Item | Name | Description |
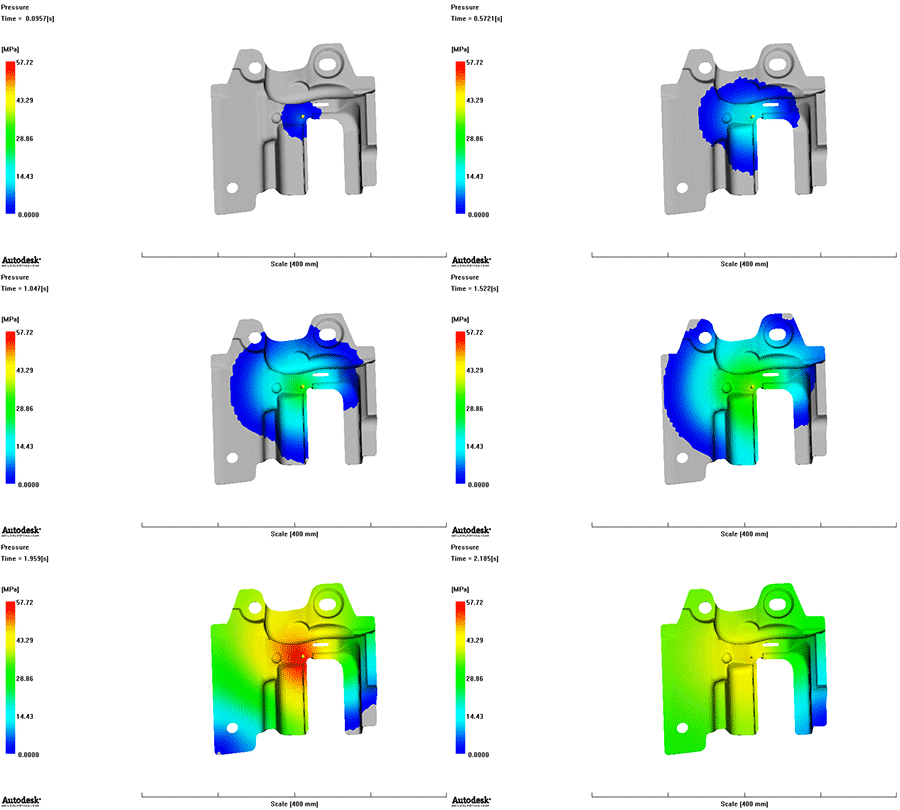
| 17 | Pressure | The Pressure result shows the pressure distribution through the flow path inside the mold at the time the result was written |
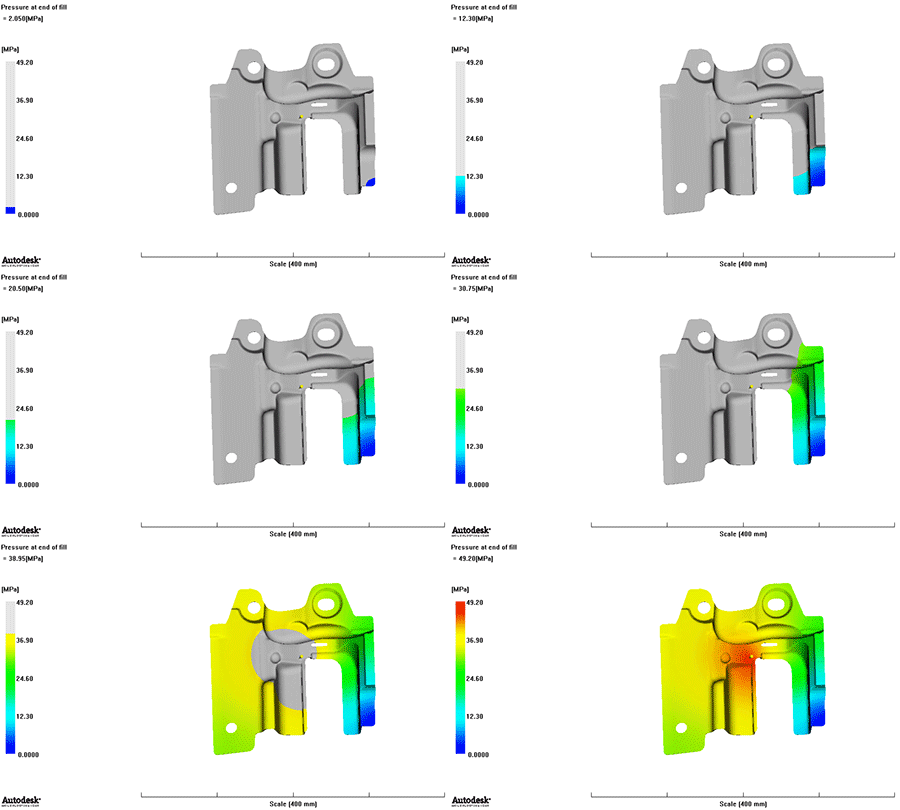
| 18 | Pressure at end of fill | The Pressure (end of filling) result shows the pressure distribution through the flow path inside the mold, at the end of the filling phase. |
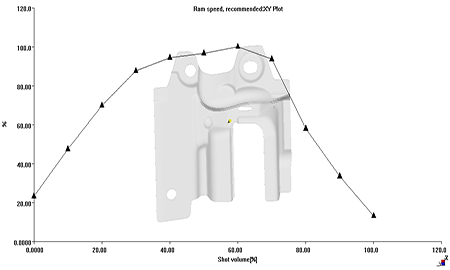
| 19 | Recommended ram speed:XY plot | The Recommended ram speed result shows the optimal injection profile. After the filling analysis, it will define an injection profile that keeps the melt front area constant. |
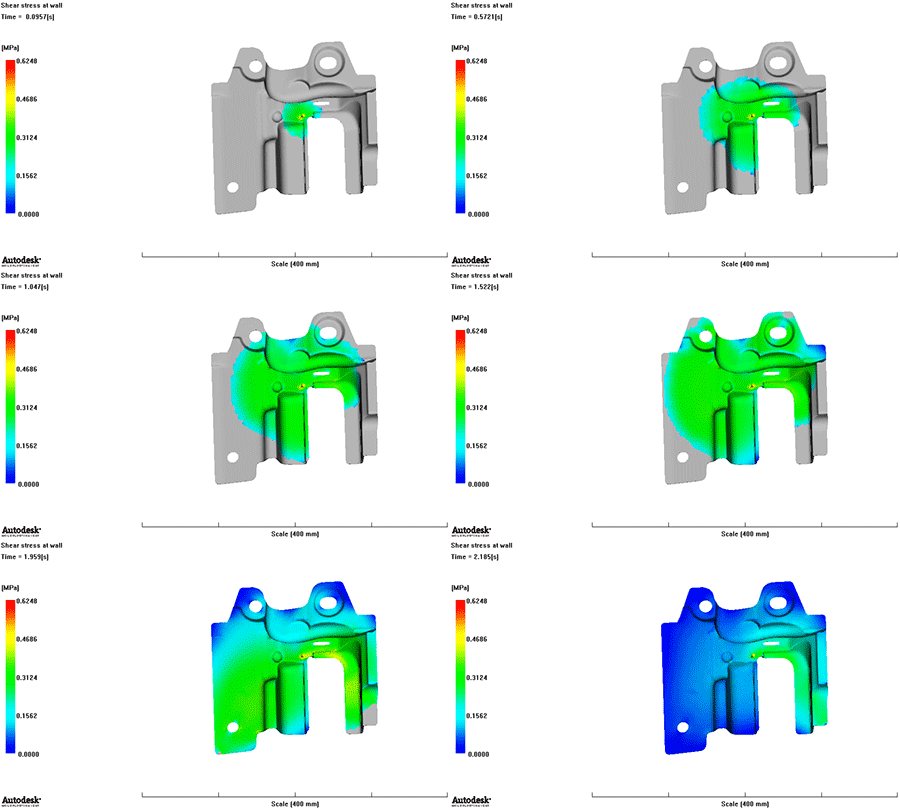
| 20 | Shear rate at wall | The Shear stress at wall result shows the shear stress in the cavity wall at the time the result was written. This result relates to the guideline provided in the material database. |
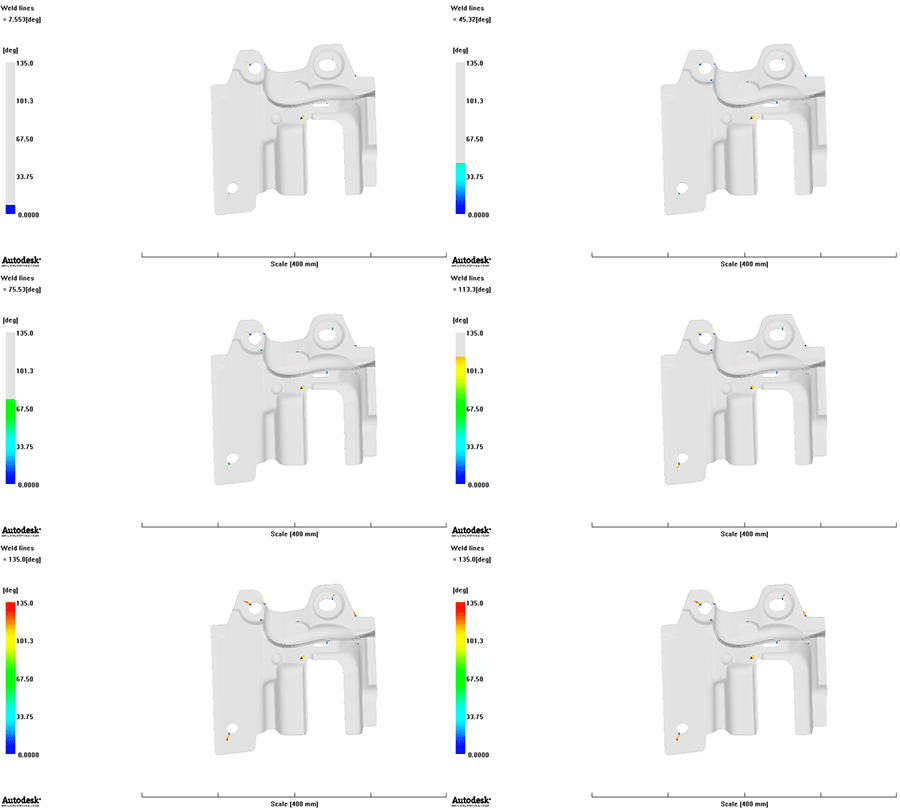
| 21 | Weld lines | The Weld lines result shows where weld lines are likely to occur on your model. Weld lines occur in places where two flow fronts have converged. The presence of weld lines may indicate a structural weakness and/or a surface blemish. |
Condition Description Reasons Solution 1 if there are too many small holes in the surface it ……
Compared with traditional fuel vehicles, the lightweight of electric vehicles is more important. S……
Condition Description Reasons Solution Condition 1: The surface areas which are incompl……